Chapter 7 Example Project: The Biscuit Study
7.1 Objective of the Test
The data set that we use as a main example throughout this book comes from a sensory study on biscuits. The study was part of project BISENS funded by the French National Research Agency (ANR, programme ALIA 2008). These biscuits were developed for breakfast consumption and specifically designed to improve satiety.
The study was conducted in France with one hundred and seven consumers who tested a total of 10 biscuit recipes (including 9 experimental products varying in their fiber and protein content), as fibers and proteins are known to increase satiety.
The study aimed to measure the liking for these biscuits, its link with eaten quantities and the evolution of hunger sensations over ad libitum consumption. All the volunteers therefore participated to ten morning sessions in order to test every product (one biscuit type per session). After they completed all the sessions, they also filled a questionnaire about food-related personality traits such as cognitive restraint and sensitivity to hunger.
Parallel to this, a panel of nine trained judges performed a quantitative descriptive analysis of the biscuits. They evaluated the same 10 products as well as an additional product whose recipe was optimized for liking and satiating properties.
Data from the biscuit study are gathered in three Excel files that can be accessed here [ADD LINK HERE]:
- biscuits_consumer_test.xlsx
- biscuits_sensory_profile.xlsx
- biscuits_traits.xlsx
7.2 Products
In total, 11 products were considered in this study. They are all breakfast biscuits with varying contents of proteins and fibers (Table 7.1). Products P01 to P09 are prototypes whereas product P10 is a standard commercial biscuit without enrichment. The eleventh product Popt is an additional optimized biscuit that has been evaluated only by the trained panel for descriptive analysis.
Product | Protein | Fiber | Type |
P01 | Low | Low | Trial |
P02 | Low | High | Trial |
P03 | High | High | Trial |
P04 | High | High | Trial |
P05 | High | Low | Trial |
P06 | High | Low | Trial |
P07 | Low | High | Trial |
P08 | High | Low | Trial |
P09 | High | High | Trial |
P10 | Low | Low | Commercial product |
POpt | High | Low | Optimized trial |
7.3 Consumer test
7.3.1 Participants
107 women who were all regular consumers of breakfast biscuits participated to the test. The biscuits_traits.xlsx file gives information about their Body Mass Index (BMI) (Q4-Q6) and their socio-demographics (Q7-Q11: marital status, household, income, occupation, highest degree).
This files also gives participants’ answers to a self-assessment questionnaire (Q12-62) that evaluates eating behavioral traits with emphasis on the tendency to control food intake cognitively. Resulting scores are loaded into three factors: cognitive restraint (conscious restriction of food intake in order to
control body weight or to promote weight loss), disinhibition (or emotional eating), and susceptibility to hunger (or uncontrolled eating, i.e. tendency to eat more than usual due to a loss of control over intake accompanied by feelings of hunger). This questionnaire is thus known as the Three-Factor Eating Questionnaire (TFEQ) (Stunkard and Messick 1985) and is one of the most commonly used questionnaires to evaluate eating behaviors in relation to overweight or obesity (Blundell et al. 2010). Calculation of these factors is detailed in chapter [10].
7.3.2 Test design
The presentation order of the different products was randomized across the panel. Again, consumers evaluated one biscuit type per day/session.
The design of the sessions is summarized in Figure 7.1 with main measured variables. After they first rated their appetite sensations using visual analog scales (VAS), the participants tasted and rated one biscuit for liking. They were then served with a box of the same biscuits for ad libitum consumption (with a maximum of 10 biscuits), followed by a new questionnaire regarding their liking, pleasure and appetite sensations.
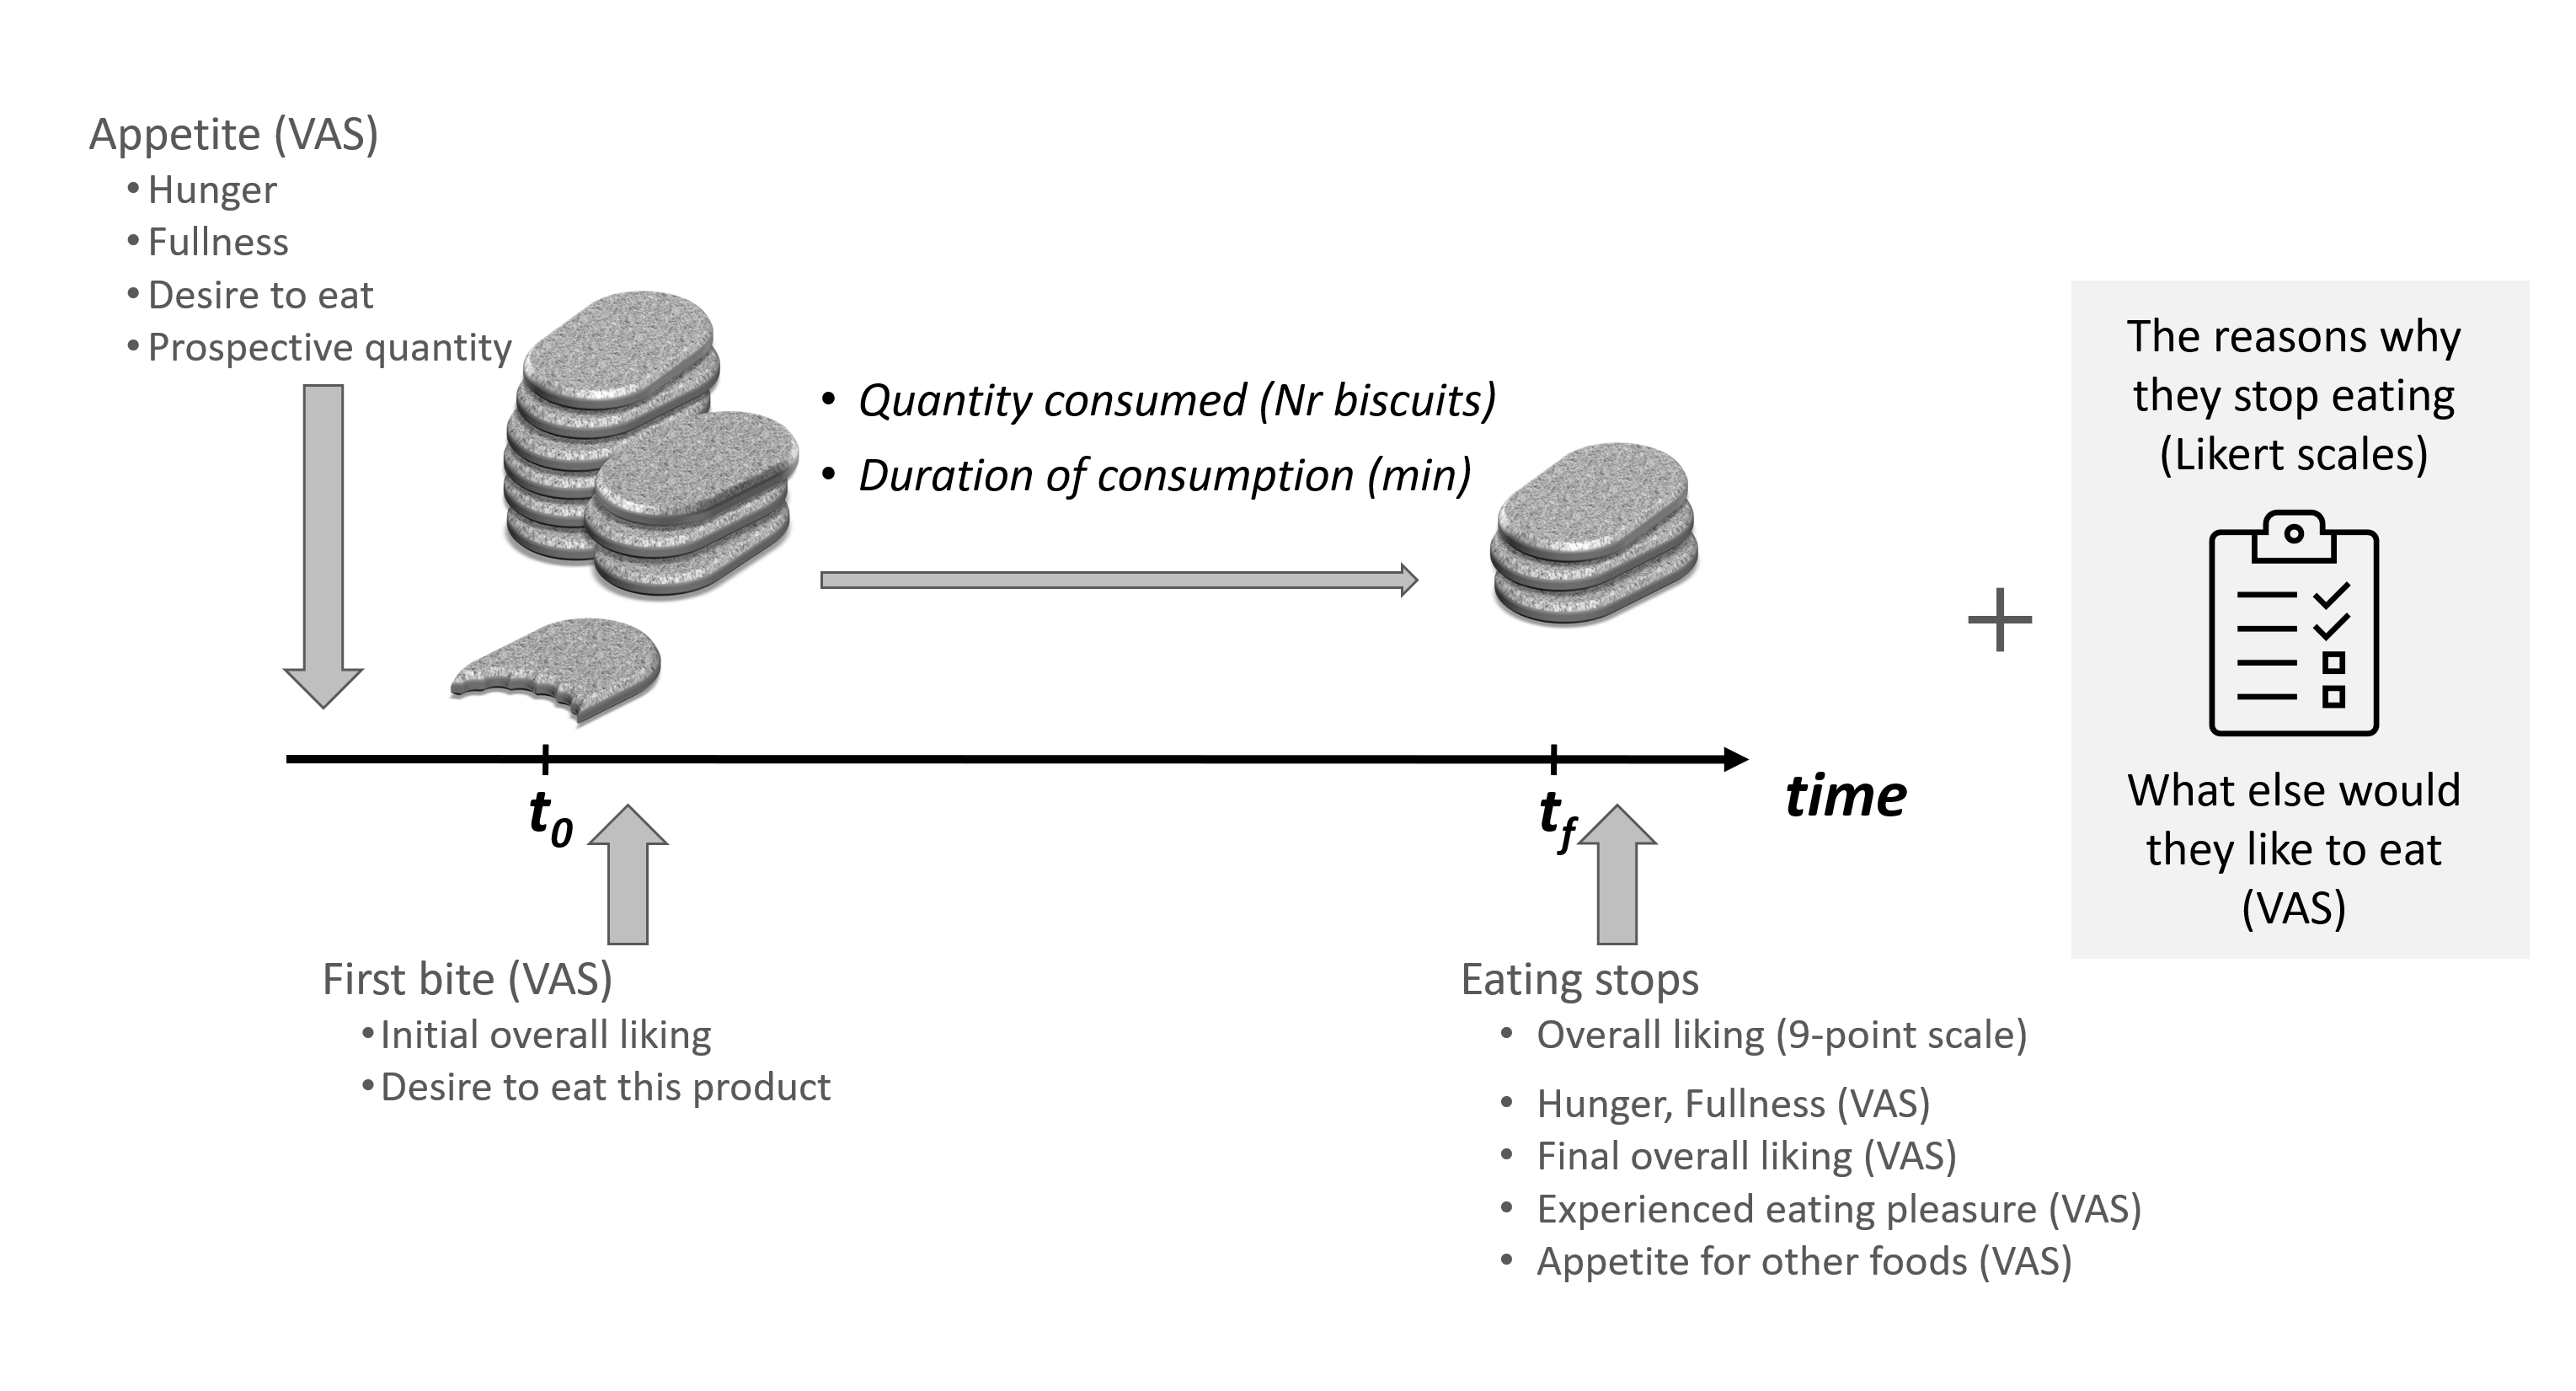
Figure 7.1: General design for the consumer test of the biscuit study. Participants were served with a different set of biscuits every session.
The liking was measured with two different scales:
- with a horizontally oriented unstructured linear scale (i.e. VAS) anchored with ‘I don’t like this biscuit at all’ (left end) and ‘I like this biscuit a lot’ (right end) at two different times: after the first bite and at the end of their consumption.
- with a vertically oriented semantic nine-point hedonic scale when stopping their consumption. VAS scales are frequently used in nutrition studies (Stubbs et al. 2000), whereas the nine-point hedonic scale is more popular in sensory and consumer science (Peryam and Pilgrim 1957; Wichchukit and O’Mahony 2015).
Once done, participants were asked about the reason(s) why they stopped eating (6 potential reasons rated with Likert scales ranging from strongly disagree to strongly agree). They were also asked how much they would like to eat other types of foods (11 food items rated using a VAS).
The time spent in the booth and the number of biscuits eaten by each participant was recorded by the experimenters, as well as the type of drink they selected and the approximate volume they drank during each session. These data are stored in biscuits_consumer_test.xlsx, in the second tab named Time Consumption.
7.4 Sensory descriptive analysis data
A panel of 9 trained judges evaluated the 11 products on 32 sensory attributes (8 attributes for aspect, 3 for odor, 12 for flavor, 9 for texture).
For each product, the judges individually reported the perceived intensity of each attribute on an unstructured linear scale. Intensities were automatically converted by the acquisition system into a score ranging from 0 to 60. These data are stored in biscuits_sensory_profile.xlsx.